
Wait! Don’t Go Yet! 👋
Become a Member Today and Unlock Access to All eBooks! 😍
Thousands of eBooks at your fingertips. Read, learn, and grow anytime, anywhere ✨

Become a Member Today and Unlock Access to All eBooks! 😍
Thousands of eBooks at your fingertips. Read, learn, and grow anytime, anywhere ✨
This article is an introduction to the Node-RED dashboard with Raspberry Pi. We’ll cover how to install Node-RED Dashboard and exemplify how to build a graphical user interface for your IoT and Home Automation projects.
You need a Raspberry Pi board—read Best Raspberry Pi Starter Kits. We assume that you are familiar with the Raspberry Pi, you know how to install the operating system, and you know how to establish an SSH connection with your Pi. You can take a look at the following tutorials first:
You should have Node-RED installed on your Pi. For an introduction to Node-RED, read this blog post Getting Started with Node-RED on Raspberry Pi.
Node-RED Dashboard is a module that provides a set of nodes in Node-RED to quickly create a live data dashboard. For example, it provides nodes to quickly create a user interface with buttons, sliders, charts, gauges, etc.
To learn more about Node-RED Dashboard you can check the following links:
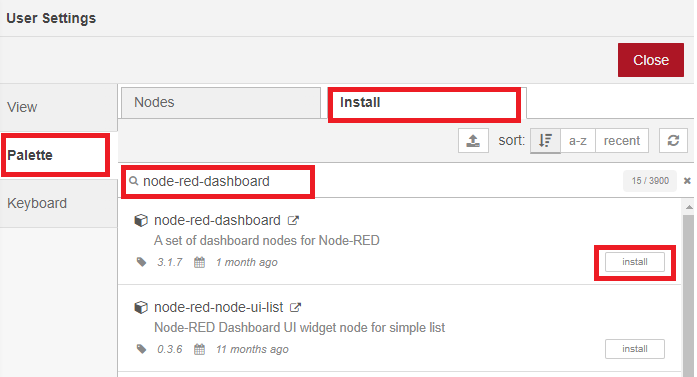
You can install Node-RED dashboard nodes by going to Menu > Manage Palette. Then, search for node-red-dashboard and install it.
After installing, the dashboard nodes will show up on the palette.

Nodes from the dashboard section provide widgets that show up in your application user interface (UI). The user interface is accessible on the following URL:
http://Your_RPi_IP_address:1880/uiFor example, in my case:
http://192.168.1.106:1880/ui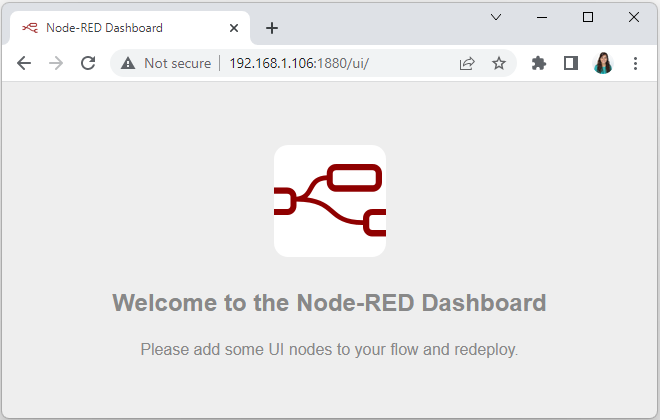
At the moment, you’ll see the previous screen when you access the UI. That’s because you haven’t added any of those dashboard nodes to the flow. We’ll do that in the following section.
In this section, we’re going to show you how to create your UI (User Interface) in Node-RED using the Node-RED dashboard nodes.
The user interface is organized in tabs and groups. Tabs are different pages on your user interface, like several tabs in a browser. Inside each tab, you have groups that divide the tabs into different sections so that you can organize your widgets (buttons, sliders, charts, gauges, forms, etc.).
Every widget should have an associated group that determines where the widget should appear on the user interface.
To create a tab and a group, follow the next instructions.
In the top right corner, click on the little arrow icon, and click on Dashboard.
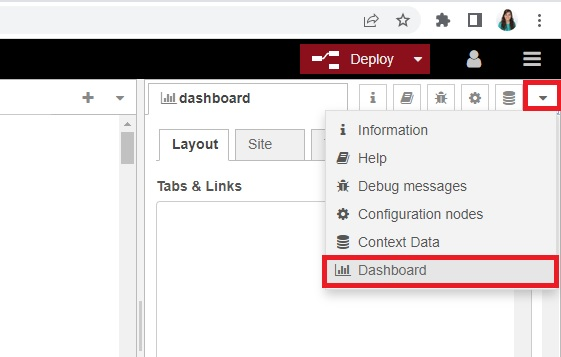
Make sure you have the Layout tab selected. Then, click on the +tab button to create a tab, it will be called Tab 1 by default.
After creating a tab, you can create several groups under that tab. You need to create at least one group to add your widgets. To add a group to the created tab, you need to click on the +group button.
Then, click on the +group button to create a group inside that tab—it will be called Group 1 by default.
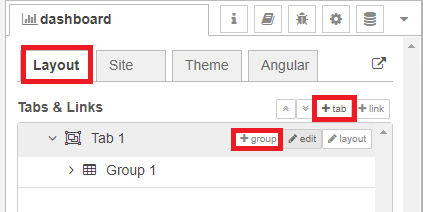
You can click on the Tab and Group edit buttons to change their properties.
For example, click the edit button for Tab 1.
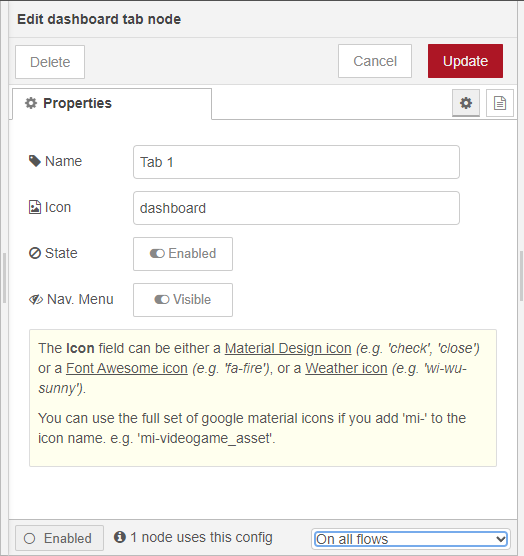
You can edit the tab’s name and change its icon:
After making changes, click the Update button.
Now, edit the group by clicking on the group edit button. The following window will open.
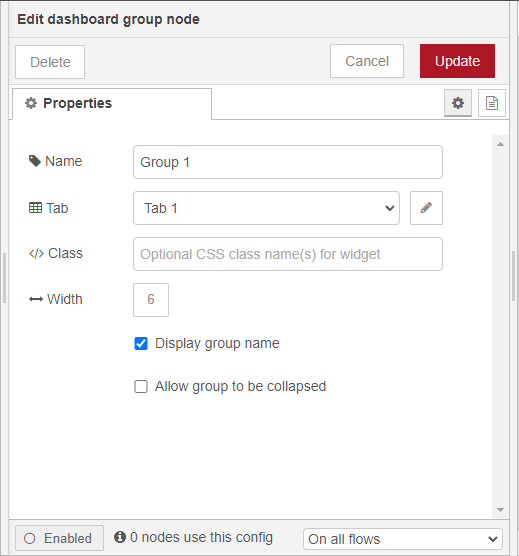
You can edit its name, select its corresponding tab, and change its width. According to the Node-RED dashboard documentation, each group element has a width of 6 ‘units’ (a unit is 48px wide by default with a 6px gap).
At the moment, you have created a tab and a group using the Node-RED dashboard. To see them, you need to add a widget.
For example, add a switch (from the dashboard section, not from the function section—you need to scroll down through the palette to find the dashboard nodes) node to the flow.

Double-click on it to check its properties. By default, it will be added to the group and tab you created previously. Deploy your app.

Now, go to the following URL, to access the user interface created.
http://Your_RPi_IP_address:1880/uiFor example, in my case:
http://192.168.1.106:1880/uiYou’ll see something as follows:
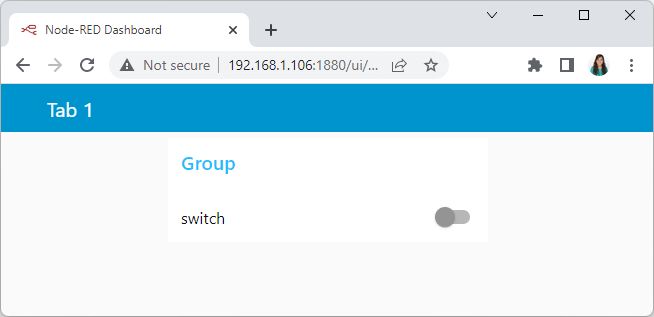
The Node-RED Dashboard has a white background and a light blue bar by default. You can edit its colors and font in the Theme tab when you open the dashboard option.
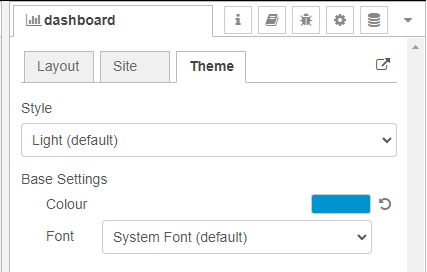
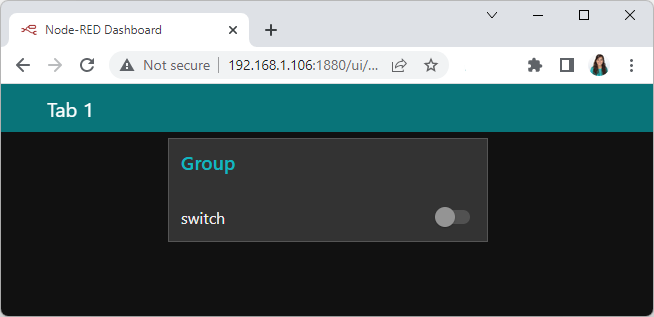
Change the style, deploy the changes and see the Dashboard UI changing its colors. For example, like in the following figure:
At the dashboard window, you have another tab called Site that allows you to do further customization, as shown in the figure below.
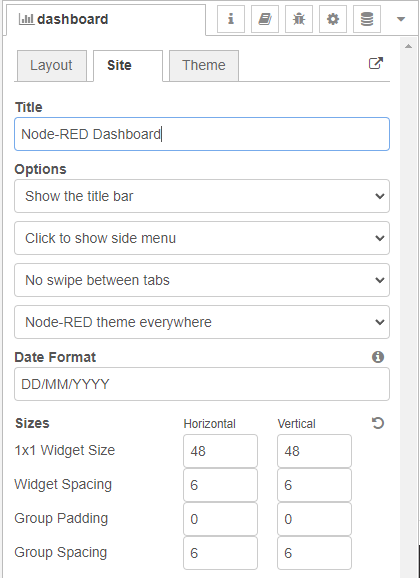
Feel free to change the settings, then deploy the changes and see how the UI looks. At the moment, you won’t see much difference because you only have one widget. Those changes will be noticeable when you start adding more widgets to the UI.
In this section, we’re going to make a dashboard example to show you how you can build and edit your own dashboard – we won’t actually add functionalities to the widgets – we’ll do that in future projects. This dashboard will have the following features:
On the top right corner of the Node-RED window, select the dashboard tab and create two new tabs by clicking on the +tab button.
Edit one tab with the following properties:
And the other one with the following:
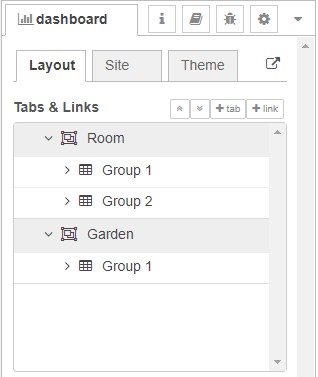
Then, add two groups to the Room tab and one group to the Garden tab. The following figure shows how your dashboard layout looks.
Add a switch, a slider, a colour picker, and a gauge to the flow as shown in the following figure:
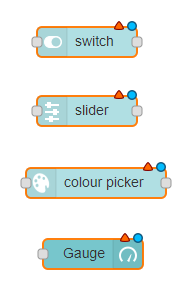
Double-click on the switch. A new window pops up.
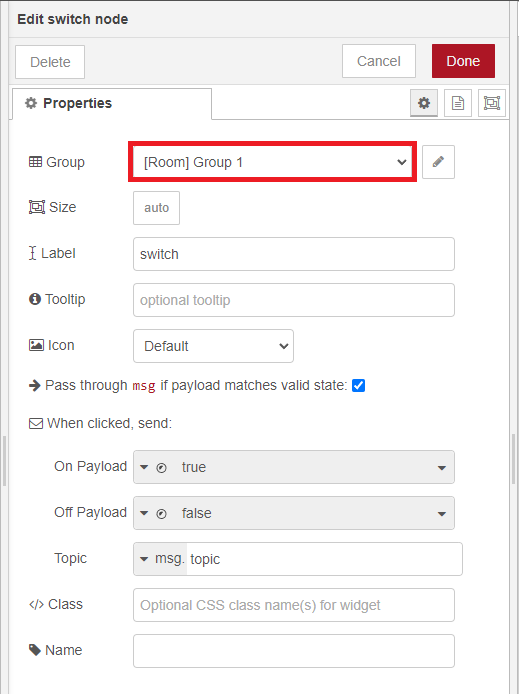
In this new window, you can choose where you want to place your button widget on the user interface. In this case, we want it to appear in the Room tab, Group 1, as highlighted in red in the previous figure.
Then, do the same for the other widgets, but add them to the following groups:
Deploy the changes and go to the dashboard UI to see how it looks.
http://Your_RPi_IP_address:1880/ui
Your dashboard has two tabs: the Room and the Garden, as shown in the following figure:
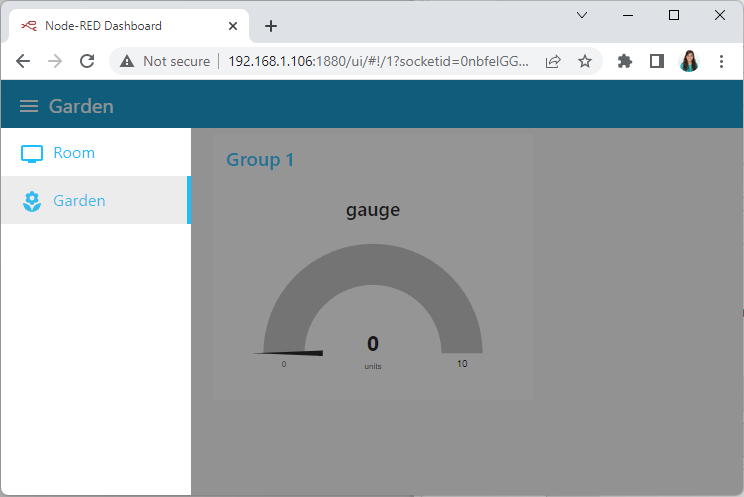
Here’s what the room tab looks like with the two groups.
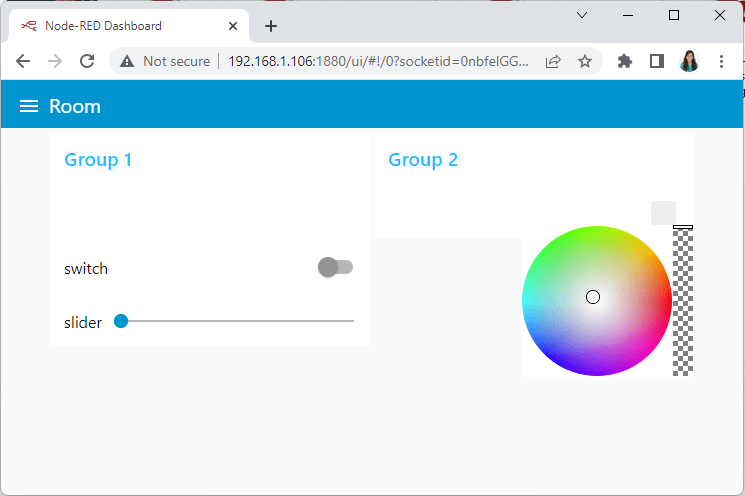
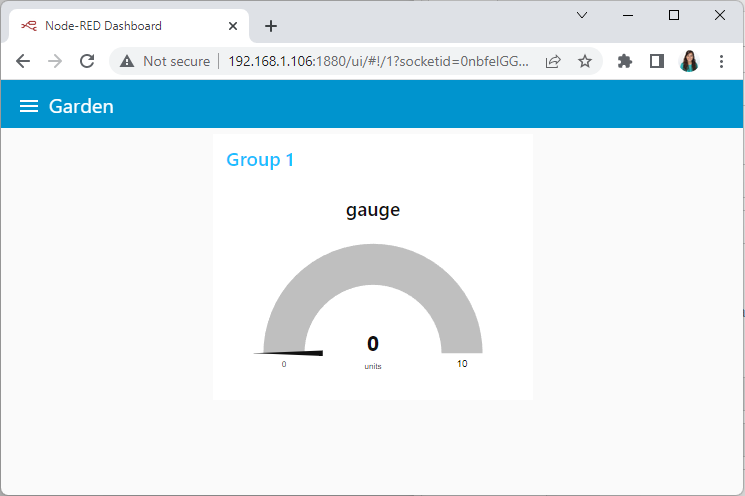
And here’s how the Garden tab looks with one group.
In this tutorial, you’ve learned how to use Node-RED dashboard nodes to create a user interface. You can add several widgets like sliders, buttons, forms, charts, and gauges to create a nice application for your IoT or Home Automation projects.
We hope you’ve found this tutorial useful.
Thanks for reading!